FIBONACCI RETRACEMENT
What is Fibonacci Retracement?
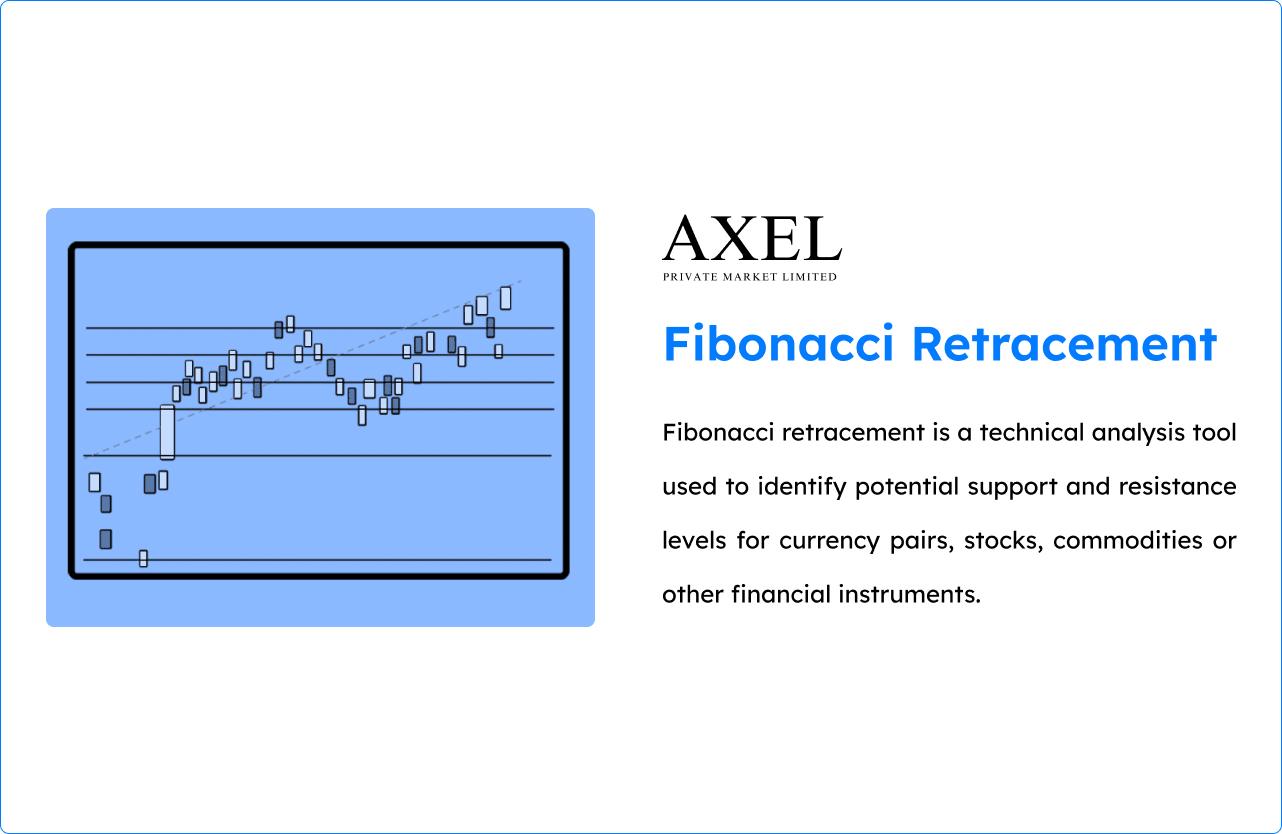
The renowned Fibonacci sequence is the source of the Fibonacci retracement levels. They can predict potential support and resistance zones for financial markets. Ancient India conceptualized these horizontal lines. They denote common retracement percentages of 23.6%, 38.2%, 61.8%, and 78.6%. A price may return to these percentages before continuing its prior trending direction. This tool is useful because it can delineate retracement levels. It can do this between any defined high and low prices. It is adaptable. Many technicians accept the influence of these figures in markets. They base this acceptance on empirical evidence. They ground the principles of Fibonacci numbers, as they are seen in nature.

Traders seek to exploit rebounding price action at Fibonacci levels. They go long on bounces when trends are up, and short on pullbacks when patterns point down. They presume that retracements will stop and momentum will continue within prevailing channels. Fibonacci analysis offers guideposts for navigating ebb and flow in financial variance. It helps predict bullish buy zones and bearish sell zones.
History of Fibonacci Retracements
The renowned mathematician Leonardo Fibonacci traced back the origins of Fibonacci numbers. He first published the sequence in his 1202 book Liber Abaci. Indian mathematicians introduced him to these numbers. He did not discover them himself. Fibonacci numbers have a natural occurrence in patterns found throughout nature. In the early 20th century, mathematicians began exploring these numerical relationships more. In the 1960s, technical analyst Gilbert Alexander first applied Fibonacci ratios to analyze retracement levels in stock prices. This laid the foundation for the indicator known today.

Through the 1970s and 1980s, analysis software advanced. More technical models and charting tools incorporated Fibonacci retracements. Their predictive power in anticipating retracement zones rose in popularity among traders. Fibonacci retracements have become one of the most prevalent technical tools nowadays. Global markets rely on them. The inherent Fibonacci patterns owe their continued empirical validity. These patterns are observable both in nature and in financial market fluctuations.
Fibonacci Retracement Levels
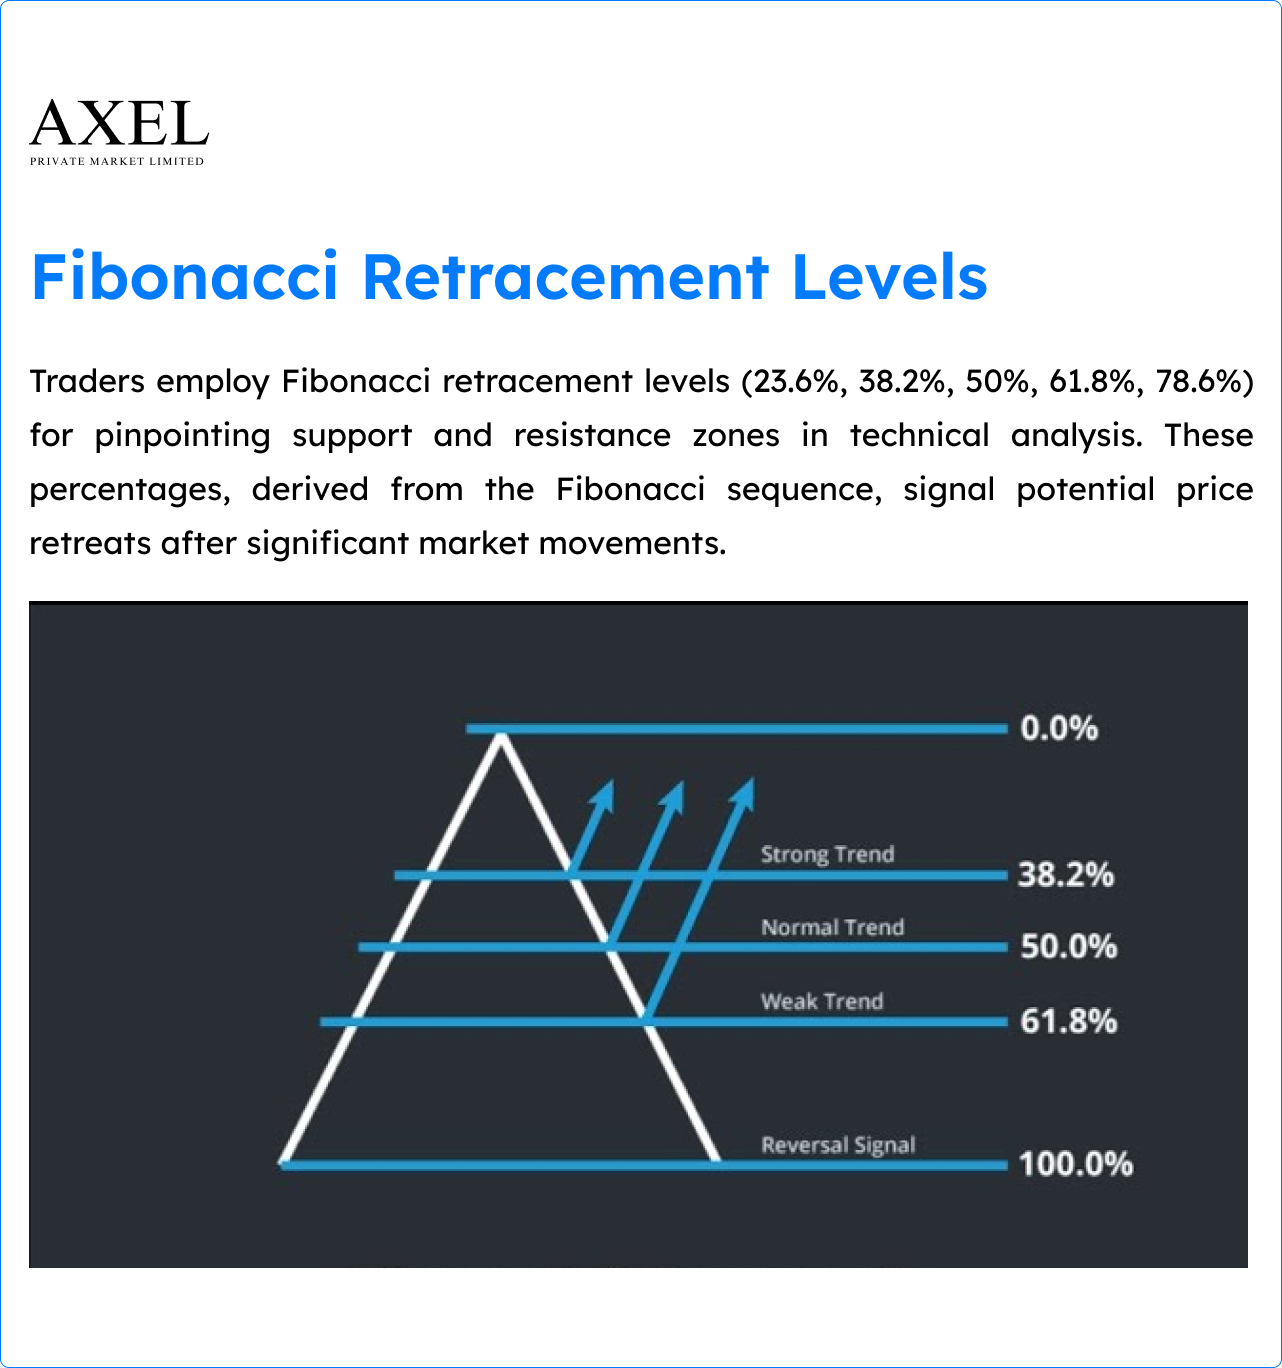
In technical analysis, traders use Fibonacci retracement levels. They do this to identify potential support and resistance zones for asset prices. These levels show the percentages at which the price may retreat. This happens after a significant movement. The Fibonacci sequence of numbers forms the basis for the percentages. In this sequence, each number is the sum of the two preceding ones. Traders draw horizontal lines on the chart at the key retracement levels of 23.6%, 38.2%, 50%, 61.8%, and 78.6%. This helps them identify support and resistance areas.

The 50% retracement level is not actually part of the Fibonacci sequence. Nonetheless, we included it. These lines act as levels where the price may pause or reverse direction after a recent move. If the price holds above a support level or below a resistance level, the original trend may continue. A break below support or above resistance could signal a potential trend change.
Fibonacci Retracement Settings
Traders use Fibonacci retracement levels to identify potential reversal zones. The levels are a popular technical indicator. The basic application involves drawing retracement lines based on key Fibonacci percentages. Users can customize various settings on many charting platforms. They can optimize how the indicator is displayed and calculated. The table below outlines the common configuration options. These options are available when applying Fibonacci retracements to a price chart. This allows traders to tailor the indicator settings to suit their preferences and analytical approach.
Select the start and end points to determine the high-low price swing being analyzed. Retracement levels Choose specific levels to display out of the defaults (23.6%, 38.2%, 50%, 61.8%, 78.6%) or custom levels. Select the visual appearance of the retracement lines, such as solid or dashed. Pick the color used to display the retracement lines. Line width Set the pixel width of how thick or thin the lines appear. Save as template Save customized settings as a template to reuse across assets. Dynamic updating Automate recalculation of levels on chart updates for intraday analysis.
Fibonacci Retracement Calculator
Here are the formulas for calculating the Fibonacci retracement levels:
-
Retracement Level 1 (23.6%): Value = High Price – (High Price – Low Price) x 23.6%
-
Retracement Level 2 (38.2%): Value = High Price – (High Price – Low Price) x 38.2%
-
Retracement Level 3 (50%): Value = High Price – (High Price – Low Price) x 50%
-
Retracement Level 4 (61.8%): Value = High Price – (High Price – Low Price) x 61.8%
-
Retracement Level 5 (78.6%): Value = High Price – (High Price – Low Price) x 78.6%
For example, with a high of $150 and low of $100:
-
Level 1 (23.6%): 150 – (150-100) x 23.6% = 150 – 30 x 23.6% = 150 – 7.08 = 142.92
The formulas are simple. They calculate the percentage of the high-low range and subtract it from the high price. This shows how to derive the Fibonacci retracement levels. Let me know if you need any part of the explanation clarified.
HOW TO DRAW FIBONACCI RETRACEMENT IN UPTREND?
Here’s how to draw Fibonacci retracement levels in an uptrend. Axel Private Market suggests this for you.
Identify the Uptrend
-
On the chart, connect points where the lows form a upward sloping line. This establishes the trend direction.
Select Start/End Points
-
This determines the price swing/range to analyze
-
Look back along the trendline and select a low that did not breakthrough as point 2 (end)
-
The most recent significant high is point 1 (start)
Apply the Fib Tool
-
Common default levels of 23.6, 38.2, 50, 61.8 and 78.6% appear
-
Click on point 1, then point 2 to define the retracement range
-
You can find the Fibonacci retracement tool/indicator under the indicators menu.
Analyze the Levels
-
Watch for reactions like stalling, reversing at the levels
-
These extend horizontal across the entire chart
-
Red lines mark where projected levels intersect the retracement arc
Confirmation of Support
-
Break of lower levels implies the retracement ended
-
A bounce/pause followed by continuation indicates level held
Adjust Over Time
-
As the trend matures, redraw start/end points for new highs/lows
-
Track how retracement setups evolve on higher timeframes
FIBONACCI RETRACEMENT TRADINGVIEW
TradingView has built the Fibonacci retracement tool. It makes it easy to incorporate Fibonacci analysis into your chartwork. To start, access the tool by searching for it under the Indicators menu. With the tool activated, you can then identify the swing you want to analyze. Click on the recent high to mark the first point. Then, click the preceding significant low to define the extreme price range.
This action draws the retracement arc between the two points you selected. By default, the key Fibonacci ratios of 23.6%, 38.2%, 50%, 61.8% and 78.6% will appear as horizontal lines intersecting the arc. But, you have the ability to customize which levels you want to display. Open the tool settings to select specific percentages. Turn individual lines on and off as needed.
Additionally, formatting options are available. You can change characteristics like line thickness, color, and style. This allows you to distinguish Fibonacci levels on the chart. A handy feature is the ability to interact with drawn lines . Click on any level to see its exact price readout or hover for the percentage value. You can also annotate lines to highlight pullback reactions for reference later on.
For enhanced flexibility, TradingView supports overlaying many retracements. This lets you compare how different swings interact with Fibonacci targets. As the market evolves, drag the starting and ending points to refresh levels. Do this according to new highs and lows.
BEST TIME FRAME FOR FIBONACCI RETRACEMENT
Here are some thoughts on the best timeframes to use Fibonacci retracements:
-
Daily and weekly charts provide stronger support and resistance levels. They encompass more price data over time. Major swings and retracements on daily/weekly often say primary trend direction.
-
4hr/Daily charts: Mid-timeframes like 4hr and daily capture retracements within primary trends. They can identify potential reversal zones where shorter timeframes may bounce or stall.
-
Intraday traders use 1-hour and 4-hour charts to spot retracement levels within smaller price moves. These lower timeframes are below the daily chart. The 1hr and 4hr often interact with daily Fib levels.
-
5min/15min charts: Very short timeframes on 5min and 15min charts are useful for day traders. But Fibs may produce many signals requiring tighter stops.
In general, blending Fibonacci analysis across many timeframes provides the most robust picture. For example, daily, 4hr, and 1hr. Daily/weekly levels provide context of primary trend strength. While hourly/lower frames help identify retracement reactions worth exploiting.
Confirm Fib retracements with other technical indicators or patterns on the chosen timeframe. Combining tools paints a clearer picture of potential reversals.
In summary, use daily to 4-hour charts. Identify primary Fibonacci support and resistance levels. And blend those levels with hourly/lower frame analysis.
FIBONACCI RETRACEMENT STRATEGY
The Swing Trader
-
Uses daily/4hr charts
-
Looks for swings within an established trend
-
Draws Fibs from swing high to low
-
Waits for pullbacks to find support at levels
-
Enters long/short on bounces off 23.6%, 38.2%, 50% levels
-
Targets next Fib level or major MA resistance
The Day Trader
-
1hr/15min timeframes
-
Focuses on intraday trend pullbacks
-
Draws Fibs from most recent swing
-
Watches for short term bounces off key ratios
-
Enters with tighter stops below recent swing low
-
Takes profits on candle closes below entry
The Range Rider
-
Daily or higher charts
-
Identifies prolonged sideways ranges
-
Draws multi-timeframe Fibs across whole range
-
Plots support/resistance at levels
-
Looks for breakouts or mean reversions
-
Takes trades in direction of break or bounce
The Trend Rider
-
Blends daily and 4hr charts
-
Confirms trend on daily
-
Tracks pullbacks on 4hr using Fibs
-
Enters long on support holds, shorts resistance breaks
-
Manages risk during strong trends
Match your preferred style to the right strategy, timeframe, and market conditions. The key is to do this. Combining Fibs with other technicals also enhances any trading approach.
HOW TO USE FIBONACCI RETRACEMENT?
Finding Fibonacci Retracement Levels
First, we need to identify the recent significant swing highs. Then, we can find the Fibonacci retracement levels. We also need to identify the recent significant swing lows. For a downtrend, click on the most recent swing high point and drag the cursor down to the newest swing low. For an uptrend, it’s the opposite – click on the newest swing low point and drag the cursor up to the most recent swing high.
Does this help explain how to select the start and end points of the retracement? Let me know if you need any clarification on identifying the swing points.
Now, let’s look at an example. We’ll apply Fibonacci retracement levels to a currency pair chart. We can choose a specific cross, like EUR/USD. We can analyze the trend. Then, we locate the swing highs and lows to draw the retracement Fibonacci lines. In a practical way, this will prove how to use the Fibonacci tool in technical analysis.
Uptrend
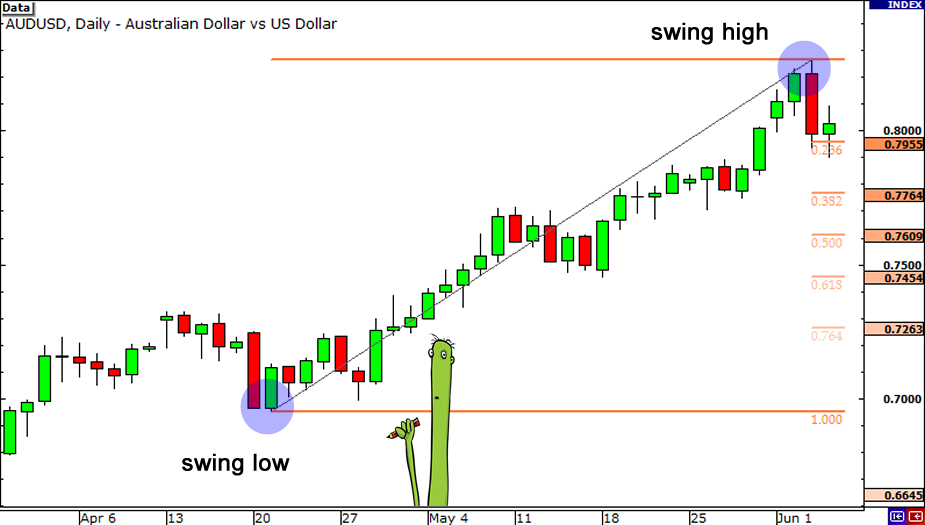
This example uses a daily chart of the AUD/USD currency pair. It illustrates the use of Fibonacci retracement levels. We identified the recent swing high of 0.8264 on June 3rd and the swing low of 0.6955 on April 20th. The charting software calculated the Fibonacci retracement levels. It did this by clicking on the swing low and dragging to the swing high. The levels are 23.6%, 38.2%, 50.0%, 61.8%, and 76.4%.

Traders expect price to find support at these levels as it retraces. Traders place buy orders at the Fibonacci ratios.
After hitting the swing high, price fell through the 23.6% level and continued lower.
It tested the 38.2% level but was unable to close below it. Later in July, the market resumed its upward move and broke above the swing high. In this case, holding long positions at the 38.2% Fibonacci support level would have been profitable.

The example demonstrates how to identify Fibonacci retracement levels. Traders can use these levels to predict where a retracing asset may find support. This is because traders behave in predictable ways at these ratios.
Downtrend
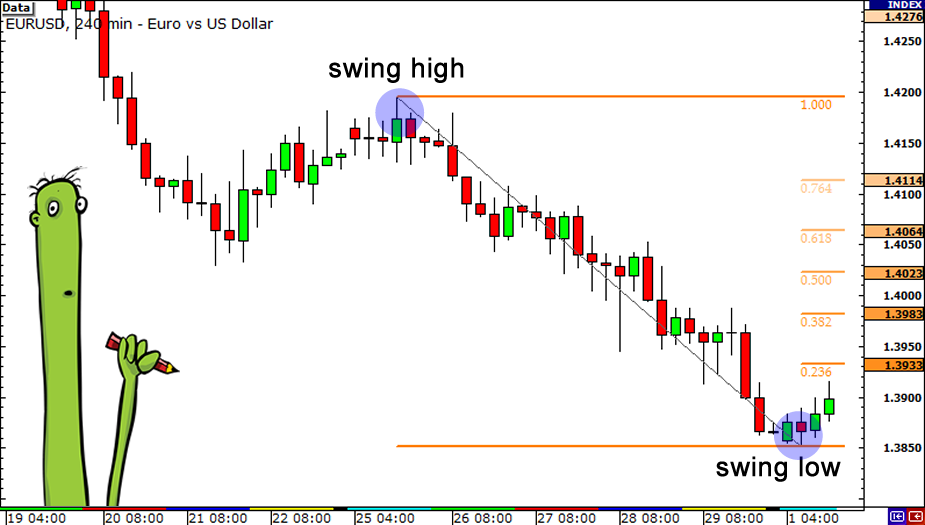
This example uses a 4-hour chart of the EUR/USD currency pair. It proves Fibonacci retracement during a downtrend.
We identified the recent swing high of 1.4195 on January 25th and swing low of 1.3854 a few days later on February 1st.
The Fibonacci retracement tool then calculated the levels at 23.6%, 38.2%, 50.0%, 61.8% and 76.4%.

For a downtrend, traders may place sell orders at these retracement levels if they expect further downside.
After reaching the swing low, the market attempted a short rally. It stalled below the 38.2% level for some time before testing resistance at the 50.0% Fibonacci level.
If buy orders were placed at either the 38.2% or 50.0% levels, as expected by Fibonacci analysis, one could have profited from the downtrend’s continuation.
During a downward price correction or consolidation against the main trend, traders can use Fibonacci retracement levels. They can identify potential barriers of resistance. This case demonstrates how. Having sell orders at these ratios may help capture profitable downtrend continuation trades.
WHAT ARE THE FIBONACCI RATIOS?
Technical analysts derive the Fibonacci ratios from the famous Fibonacci sequence. The sequence goes: 0, 1, 1, 2, 3, 5, 8, 13, 21, etc.
We calculate each number in this sequence by adding the two numbers preceding it. For example, 1+1=2, 1+2=3, 2+3=5 and so on.
This mathematical property results in consistent ratios between the numbers. , it produces the Fibonacci ratios of 23.6%, 38.2%, 50%, 61.8%, 78.6%, 100%, 161.8%, 261.8%, and 423.6%.
Although 50% is not a Fibonacci ratio because it is not produced in the calculation, it is still included. In technical analysis, traders use it as a support/resistance level.
The Fibonacci sequence provides ratios. Traders watch these for identifiable price levels. The ratios are recognized. They often manifest as areas of demand/supply. Bulls and bears aim to enter or exit the market there.
CONCLUSION
Fibonacci retracement is a useful technical indicator. It can help identify potential support and resistance levels during trends and consolidations. Traders can incorporate these identifiable price points in their analysis and trading strategy. By understanding how the ratios are derived from the Fibonacci sequence, they are able to do this.
Key Takeaways
-
Draw retracement arcs between significant swing highs and lows to calculate Fibonacci levels
-
Levels like 38.2%, 50%, 61.8% often act as support/resistance due to trader activity
-
Analyze reactions at these levels to identify reversal or continuation opportunities
-
Consider many timeframes for confluence and risk management
Balanced Approach in Application
Apply Fibonacci across assets and market conditions. It works best combined with other indicators within a broader analysis framework. Reactions at ratios may vary – confirmation of signals enhances reliability. Levels also must updating as trends evolve over time.
Continuous Learning and Adaptation
-
Technical Analysis of the Financial Markets by John Murphy is a comprehensive text. It covers the proper use of Fibonacci retracement in trend analysis.
-
In the Encyclopedia of Chart Patterns by Thomas Bulkowski, you can find extensive research on the performance stats of chart patterns at Fibonacci levels.
-
Fibonacci Trading by Carolyn Boroden is an in-depth guide. It shows how to incorporate Fibonacci in a rules-based strategy with backtested results.
-
Technical Analysis of Stocks & Commodities magazine has a section called “Monthly issue Papers.” This section reports studies of Fibonacci accuracy.
-
Investopedia Fibonacci Analytics offers interactive lessons with quizzes. It also features online workshops that analyze real trades.
-
Trade Guider Education offers free video tutorials and archived webinars. They follow currency pairs weekly, applying Fibonacci.
-
On the MyFXBook Forums Fibonacci Thread, members discuss posted Fibonacci setups and results. The discussion board allows peer review.
-
Search the archives of the Elite Trader Forum “Successful Strategies” for in-depth case studies. They’re from expert traders. The case studies are multi-part.
and case studies from top funds and analysts. They use Fibonacci.


